I am building water quality sensors which will capture geolocated data. This was my first test with this technology. This is part of my ongoing research at the Santa Fe Water Rights residency (March-April) and for the American Arts Incubator program in Thailand (May-June).
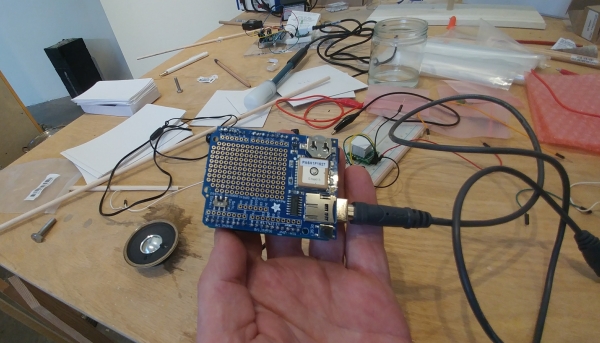
This GPS data-logging shield from Adafruit arrived yesterday and after a couple of hours of code-wrestling, I was able to capture the latitude and longitude to a CSV data file.
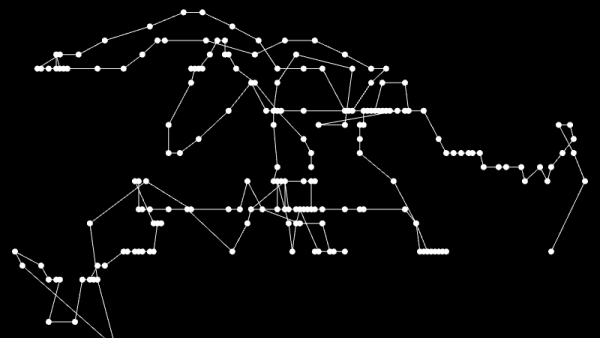
The is me walking from my studio at SFAI to the bedroom. The GPS signal at this range (100m) fluctuates greatly, but I like the odd compositional results. I did the plotting in OpenFrameworks, my tool-of-choice for displaying data that will be later transformed into sculptural results.
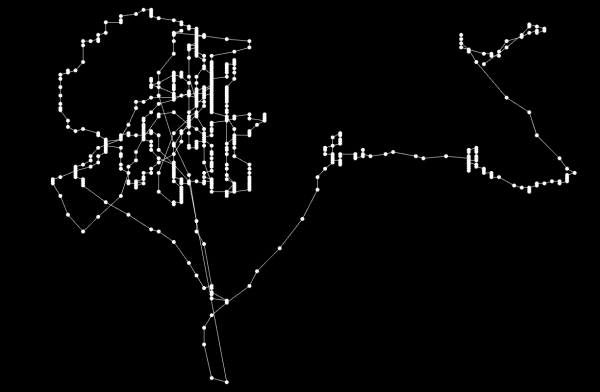
The second one is me driving in the car for a distance of about 2km. The tracks are much smoother. If you look closely, you can see where I stopped at the various traffic lights.
Now, GPS tracking alone isn’t super-compelling, and there are many mapping apps that will do this for you. But as soon as I can attach water sensor data to latitude/longitude, then it can transform into something much more interesting as the data will become multi-dimensional.
And the cover image? That would be me, shopping at Whole Foods.
For more information and updates, please join the American Arts Incubator Facebook page.